Active mutual funds can be mysterious black boxes. Here is a method to sneak a peek inside.
Mutual funds are very opaque structures. There is so much we don’t know about them, so much we are refused to access, even when we invest in them.
It is indeed very hard to access the actual composition of their assets (the individual stocks or bonds they own). This information is barely disclosed by managers for various reasons. They might fear to see their ideas and work “stolen”. They might fear being criticized for every decision they make. They might even fear that everyone realize they charging active fund fee level for passive management (which is called “closet indexing”, and is very bad, look out for it).
The main information they often give us about what we really own, is the “benchmark”. This benchmark is supposed to be a good proxy of the fund asset composition and potential risks. But most of the time the benchmark they choose seems a bit off or even misleading. It is always an index, and is therefore very theoretical, but it is not its biggest flaw.
Its biggest flaw is that every manager has the right, and happily uses it, to choose the index that pleases him. So they usually pick the one that has the greatest chance to make them look better and not especially the one that will allow us to compare them correctly with their peers. And they often choose benchmarks that do not disclose their own composition… which means they are not very usefull.
Moreover, they often create their own custom benchmarks by the combination of those various indexes. Like this famous and very successful French diversified fund which defines its benchmark as :
” 50% MSCI AC WORLD NR, 50% Citigroup WGBI All Maturities ”
How are we supposed to understand what is really inside ? How can a normal, not so passionate about it, normal investor assess the risk it bears holding this fund ?
And even if we master the separate components, how could we be sure of those components weights being representative ?
Therefore when analyzing/comparing funds we always end up with a load of custom and mixed benchmarks, which are often unknown and opaques, never easily comparable, that might not be representative of the assets really owned, and that cannot give us any information about the dynamic strategy of the fund management.
Well…
Seems like we need a better strategy to analyze and compare active funds don’t you think ?
Here is what I propose : first get a set of good benchmarks. Then use them to open up those funds black boxes in a rigorous and standardized way. Let’s do that.
So first what is a good benchmark ?
The best definition of a good benchmark was given to me when studying for the CFA exam, and they have an amazing name for it, it is called the :
THE SAMURAI METHOD !
No kidding. You cannot forget that. This acronym, despite sounding a bit childish, actually depicts a very good framework. It regroups the 7 qualities a good benchmark should uphold. Here they are:
- Specified in advance, 2. Appropriate, 3. Measurable, 4. Unambiguous, 5. Reflective of current investment opinions, 6. Accountable and 7. Investable.
I will not detail them as this will get off-topic but I do invite everyone to familiarize with this great framework for analyzing benchmarks. This CFA Institute method is specific to financial benchmarks of course but I am pretty sure that the underlying concepts could be generalized to other fields of application for my non financial readers.
Anyway, I will focus on 2 of the 7 listed criterion as they appear to me as the least respected ones in usual fund benchmarks.
- The benchmarks must be homogeneous : funds invested in the same asset class must be very strongly correlated with the corresponding class benchmark.
- They must be mutually exclusive : benchmarks from different asset classes must be sufficiently uncorrelated.
- They must all together cover the entire universe of investable securities.
Oh, so maybe could ETFs be good benchmarks ?
Indeed ! They are potentially amazing benchmarks. And this why I did chose them as the base construction blocks for my personal set of standardized benchmarks.
But let me be more specific about the reasons behind this choice :
- They individually respect the 7 SAMURAI conditions. And especially the 7th, as they are very investable.
- It is possible to find a set of trackers that covers the great majority of all available asset classes. Condition 3 is met.
- They can be selected to be sufficiently mutually exclusive in order to make them representative of a specific market segment. Condition 2.
- Finally it is possible to regroup them according to their asset class as they are, by design, very close of each other inside each asset class thus making them very homogeneous. Condition 1.
Ok so that is the theory. Let’s get to practice. Let’s create the set of benchmarks.
First we have to divide the investable securities universe into asset classes that are sufficiently mutually exclusives. This, as it is not easy, is a trial and error process. But one can easily construct a sound enough structure from scratch.
Second we have to select for each of those asset classes between 2 and 3 ETFs that are strongly correlated and representative of the asset class underlying assets. We then combine them along a standardized, simple and “Specified in advance” method to create an investable basket of ETFs for each asset class.
Third we need to correct for various standardizations problems like distributing/non distributing ETFs, missing histories, closed funds, differing currencies… this is not fun but doable.
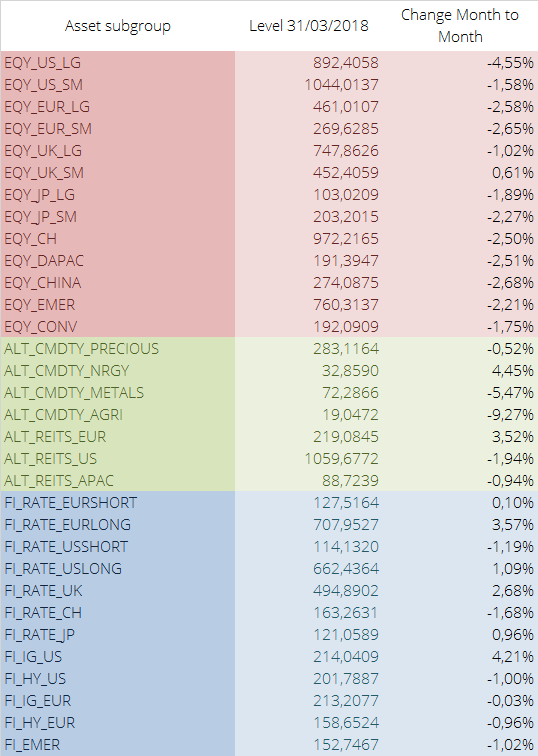
And here how I constructed, keep up, and constantly improve my own set of ETF-based benchmarks. Here is a peek at the set’s current level :
And can we analyze and compare funds with this ?
Now that we have a good set of passive ETF benchmarks, well let’s try to dissect active funds with them.
In fact this is quite straightforward now : we can “just very simply compute” the linear combination of 3 of those ETF benchmarks that is the more “appropriate” to describe the fund’s evolution. Other methods are of course possible, this is just one possibility.
By “appropriate” I of course mean closely correlated, or any similar measure of strong correspondence in risks and exposition between the fund’s and its specific custom benchmark.
By “just very simply compute” I of course mean a standard regression of the fund’s history against the benchmark’s to determine the weights of the various asset classes. This should gives us the mix that is the most representative of the fund’s allocation.
This does sound quite simple. Maybe a bit too simple ?
Good news : it works quite well !
And to show this let’s simply take an example. And I will start with a diversified French fund that performed quite well lately. It is Keren Patrimoine C (FR0000980427). It’s official benchmark is this :
50% Bloomberg Barclays EuroAgg Treasury 3-5 ans + 35% CAC 40 DNR + 15% EONIA capitalisé
The regression gives the following results when used against the set. With a correlation of 93.5% over a five year period, the fund can be decomposed this way :
- 70% in european high yield bonds
- 20% in european small cap equity
- 10% in swiss equity
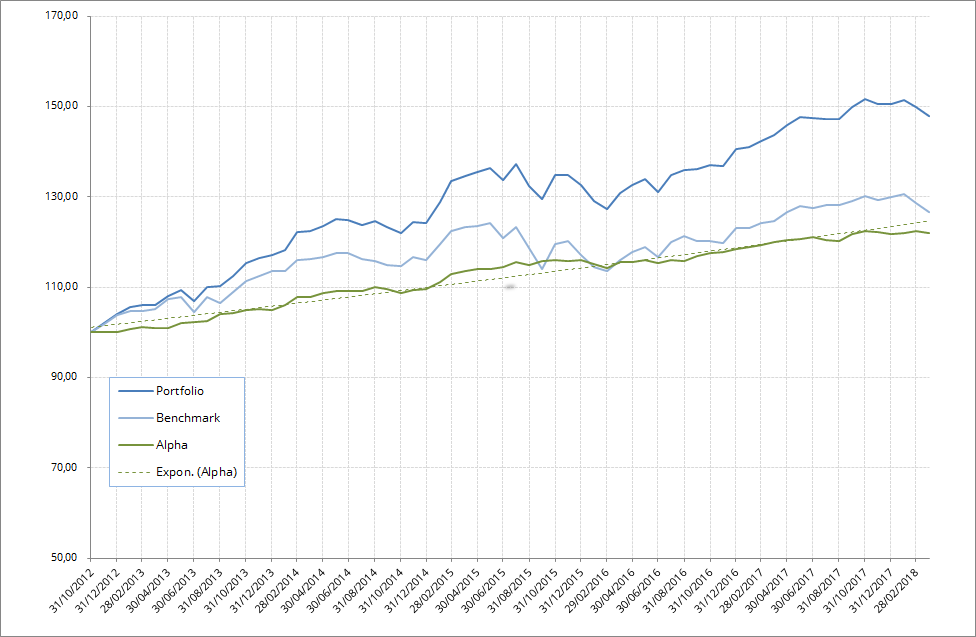
As you can see the regression is not perfect. The “Swiss” allocation result does seems a bit weird. But the correlation is indeed very high and this gives us a clear view of the fund general allocation, and a comparable investable ETFs mix we could use to reproduce its evolution. It also give us a very good benchmark to analyze its performance, and more importantly, its performance’s regularity.
BUT as there is a BUT. Of course some of you smart people noticed that this methodology, apart from numerous other minor problems, do have one big flaw. Here it is :
The *mix* is not properly “Specified in advance”. Indeed, as it computes for each fund a unique custom benchmark made of various ETFs baskets, which is okay, it does compute the *weights* of the various baskets with past information (regression on the history of fund and benchmarks), creating therefore a clear hindsight bias.
This is true and implies that the dissection could have a mix that is not representative of the current allocation of the fund, which might have changed. However let’s be honest: funds strategy and allocations are rarely changed. When a fund is over performing, its strategy is confirmed. When a fund is under performing, it is closed.
But I do concede that studying whether those computed dissections weights are actually reliable ex-post should be thoroughly studied. Data is needed for that. I am collecting it right now…
In the meantime this still constitutes a good framework for a standardized analysis of funds, be it for simple allocation analysis (“What do I really own in this fund?”) or performance analysis (“Is this manager delivering stable alpha or should I invest in those ETFs instead ?”). Maybe you could use it, or at least it most fundamental idea : ETFs are good benchmarks for active funds. I sure hope I helped anyway.